

Risk Parity
Risk Parity: An Overview
Risk Parity is a diversified asset allocation strategy which seeks improved investment returns and lower risk in comparison to similar multi-asset investment portfolios. Risk Parity attempts to achieve its aims by efficiently diversifying the investment returns and the risks equally among all of the invested assets. By equally spreading out the risk and the returns, Risk Parity has historically achieved a return which is more linear in nature and less dependent upon the returns of any one particular asset class or economic environment. In contrast, because stocks are historically much more volatile than high-grade Treasury bonds, traditional 60/40 or 70/30 portfolios have an outsized dependency upon the returns of the stock market and economic expansionary environments—making the returns of such portfolios nearly as choppy as the returns of the stock market overall.
To see how Risk Parity works it’s easiest to consider a simple two-asset portfolio consisting of S&P 500 stock index and 10 Year US Treasury Bonds. Below, is a table showing the returns and volatility for each of the assets going back to 1993.
1993-Present |
| Annual Return* | Volatility | S&P 500 Correlation | Sharpe Ratio |
10 Year Treasury |
| 5.43% | 4.93% | -0.19 | 0.66 |
S&P 500 |
| 9.67% | 15.02% | 1 | 0.53 |
Risk-Free Rate |
| 2.40% |
|
|
|
While we see that the returns of the stock market are preferable to the returns of the bond market, that return has come at a cost of weathering a volatility three times greater. That volatility difference is what makes traditional portfolio models more dependent upon the stock market for gains. While 60/40 may seem fairly balanced, when viewed through the lens of volatility that weighting looks more like this:
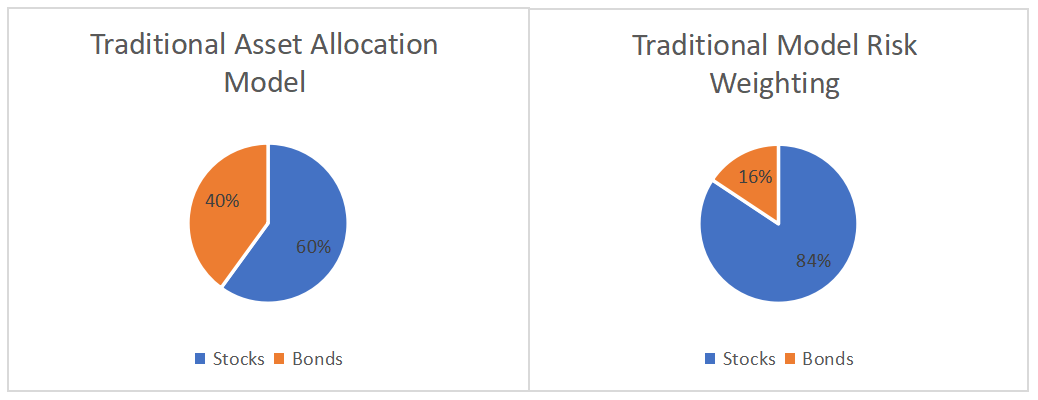
Once we see how the traditional model is overweighted from a risk perspective to the stock market, we can then begin to understand why it has failed to successfully weather some of the most recent bear markets. Here we see a graph which compares the returns for the Vanguard S&P 500 index fund versus the return of the Vanguard Balanced Index Fund (the balanced fund allocates 60% to stocks and 40% to bonds).
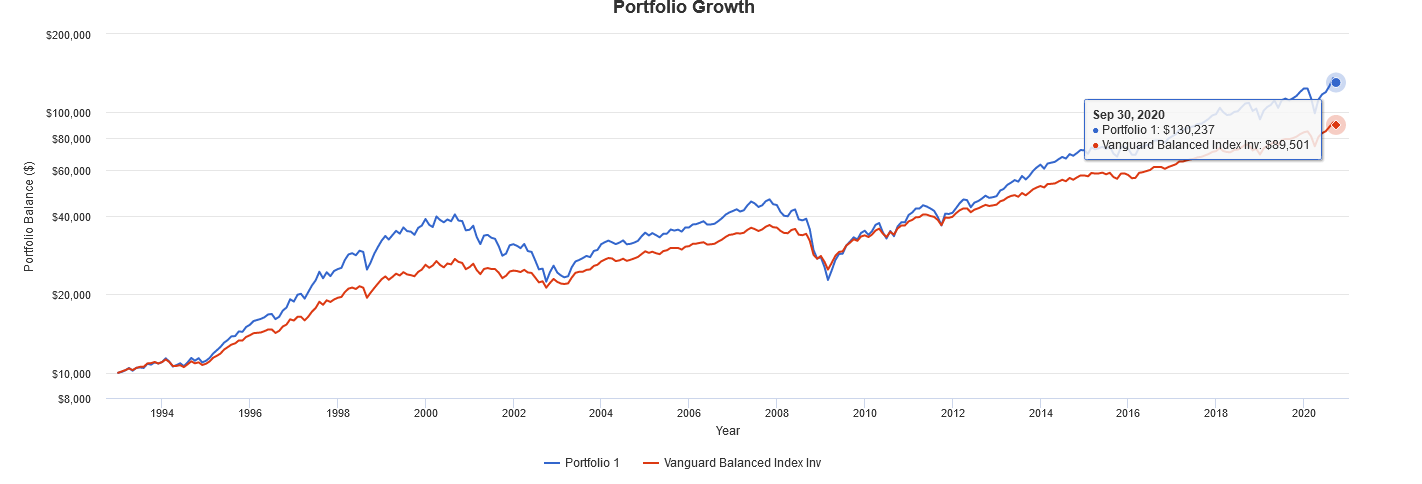
The blue line is the S&P 500, the red line the Vanguard Balanced Index Fund. We see that the two lines nearly rise and fall in synchrony. In fact, the correlation of the “Balanced Fund” to the S&P 500 is nearly 1, which indicates a near complete dependence upon a rising stock market to generate returns.
By contrast, since the Risk Parity model inversely weights assets according to its volatility, the weighting of stocks in the model is 1/3 of the weighting of bonds. In other words, the portfolio has 75% in bonds and 25% in stocks. This creates a better balanced portfolio and one that is less correlated to the stock market. Below is the same chart as above, but this time I’ve added the returns of a Risk Parity two asset allocation. The red line represents the returns of the Risk Parity model.
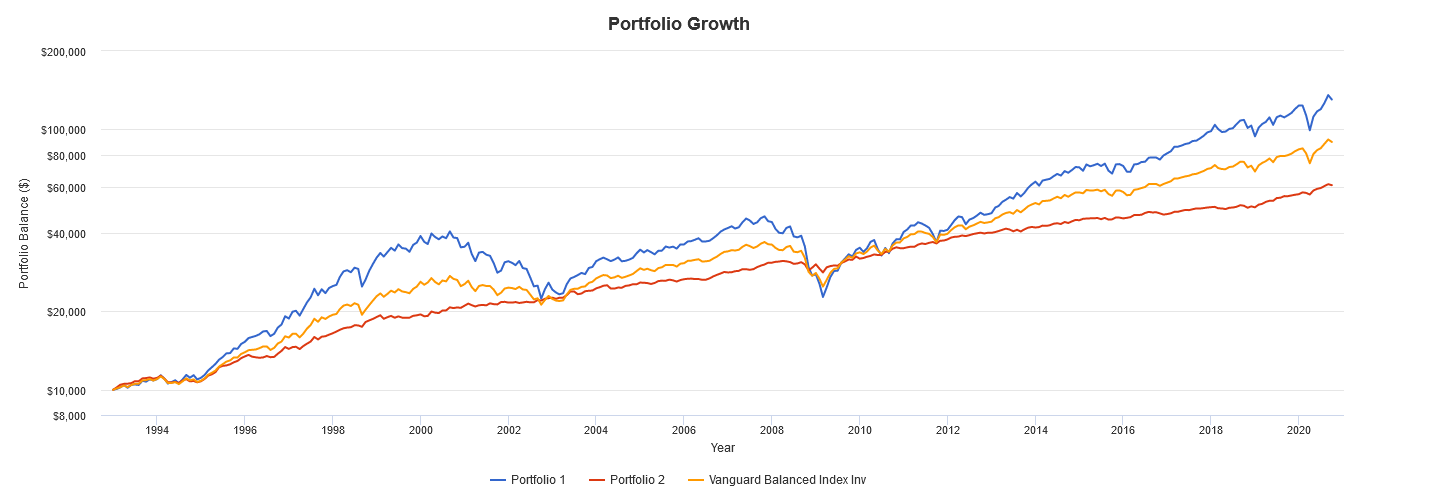
1993-Present | Initial Balance | Final Balance | Avg Return | Volatility | Max Drawdown | Sharpe Ratio | Stock Market Correlation |
S&P 500 | $10,000 | $130,237 | 9.69% | 14.63% | -50.97% | 0.55 | 1 |
Vanguard Balanced Index Fund | $10,000 | $89,501 | 8.22% | 9.09% | -32.57% | 0.66 | 0.99 |
Risk Parity | $10,000 | $61,065 | 6.74% | 4.59% | -9.65% | 0.93 | 0.64 |
The graph above shows that the returns of the simple Risk Parity model were more linear and less subjected to the swings of the stock market. In fact, during the two major bear markets, the Risk Parity model held up extremely well. However, we can see in the table above that the final returns of the Risk Parity strategy was nearly half of the return of the S&P 500. While many would like the glide path of the Risk Parity strategy, the question is asked: is there a way to achieve more similar returns to the stock market or the traditional allocation models?
Risk Parity: How to Eat Your Sharpe Ratio
While a higher Sharpe Ratio implies a better risk/return ratio, the question is always can one improve the returns of the higher Sharpe Ratio portfolio to provide the returns necessary to reach one’s investment goals? In other words, can you eat a Sharpe Ratio? The simple answer is yes. By adding leverage to the higher Sharpe Ratio portfolio one can increase the return projections of the portfolio and maintain the same risk/return ratio.
The follow-up question to that response is typically: Isn’t leverage more risky? Again the simple answer to that question is yes. Leverage always increases the risk of the asset being leveraged. Buying more of anything with less money always adds risk. However, while it may increase the risk of the original portfolio it doesn’t necessarily make it more risky than another portfolio consisting of different assets or a portfolio consisting of a different weighting of the same assets.
Let’s take a look at the same Risk Parity portfolio consisting of 75% 10 year US Treasuries and 25% S&P 500, but instead we will leverage it 150%. While many investors are initially wary of leverage, we realize that in other facets of life we utilize much greater leverage than 150%. When a homeowner purchases a home using a 20% down payment, often times the amount of leverage employed is ignored by the homebuyer. The buyer typically focuses on the mortgage payment, and frequently doesn’t view the house in terms of an investment. Yet, as many realized in 2008, there is a tremendous amount of leverage buying power utilized in a home purchase. With a 20% down payment, the buyer has employed 500% leverage, as the price of the home is five times the amount put down. In that context, buying 50 cents worth of more stocks and bonds with the same dollar may feel a bit more reasonable.
Now when we examine the investment table comparison we looked at earlier, comparing a 60/40 and 70/30 portfolio versus the 150% levered Risk Parity portfolio we see that we’ve achieved similar returns over the period 1993-Present, but have still achieved it with less volatility than the traditional models.
1993-Present | Initial Balance | Final Balance | Annual Return | Volatility | Best Year | Worst Year | Max Drawdown | Sharpe Ratio | S&P 500 Correlation |
60/40 | $10,000 | $103,087 | 8.8% | 8.4% | 30.6% | -16.9% | -28.0% | 0.72 | 0.95 |
70/30 | $10,000 | $113,298 | 9.3% | 9.8% | 32.3% | -21.9% | -34.1% | 0.67 | 0.97 |
Risk Parity | $10,000 | $119,609 | 9.3% | 6.8% | 34.0% | -6.5% | -11.9% | 0.96 | 0.61 |
S&P 500 | $10,000 | $139,904 | 9.6% | 14.4% | 37.5% | -37.0% | -51.0% | 0.54 | 1 |
As we increased the leverage, we see that the returns of the Risk Parity portfolio are now in line with the returns of the traditional portfolio models, but that there is one major difference—the overall portfolio volatility is still much lower. In fact, the returns over 27 years are fairly close to the returns of the S&P 500, but with volatility less than half of the major stock market index. Additionally, important factors such as max drawdowns are nearly 1/5 of what the S&P 500 would’ve experienced.
There are two dramatic impacts that drawdowns have on portfolio growth: the first is the obvious loss of equity, and the second is the loss of time. Most people invest for particular goals and those goals have timelines. Deeper drawdowns typically take longer to recover. Below is a graphic depiction of the difference in drawdowns between all the highlighted portfolios. Again, the green line is the S&P 500, the yellow line is the levered Risk Parity portfolio, the red line is a 70/30 portfolio, and the blue line is the 60/40 portfolio.
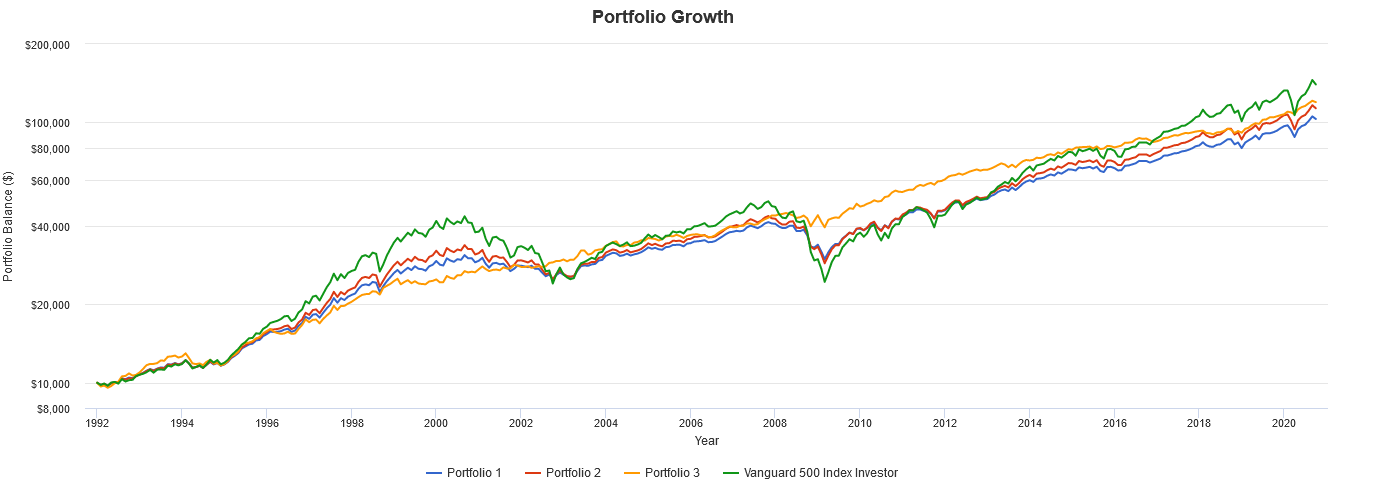
Above we see the last two major bear markets experienced since 2000. We see that the impact of the bear markets not only had a profound impact on investment values, but also resulted in an extraordinary loss of time. Looking closely we see that while the market briefly recovered the 2000 peak levels in 2007, that recovery was short-lived. In fact, the S&P 500 didn’t convincingly recover those 2000 levels until 2011, over a decade spent underwater. During that same period of time, the 60/40 and 70/30 models also experienced similar loss of money and time. By contrast, the levered Risk Parity model continued to grow over that time, more than doubling in value between 2000 and 2011. As we focus on the purpose of our investment, we need to focus on the detrimental impacts that drawdowns have on our ultimate success, realizing that financial loss and lost time are major hinderances to achieving our goals.
One Final Note
It is a question the requires answering, and it is a question that is of particular importance in our current financial climate, namely: does the current level of interest rates impact the efficacy of this type of investment strategy? The answer is that the current interest rate levels impact the forward returns for nearly all investments. As rates have declined the value of bonds have appreciated greatly. While we don’t claim to know the future for interest rates, in the current world, zero percent can no longer be a reliable floor. Many countries around the world have government bonds trading at a yield well below zero, so we need not be certain that bonds can only appreciate by a fixed amount. Likewise, low interest rates have catapulted stock prices higher in recent months. Valuation metrics like price to earnings ratios are at levels unmatched since the 2000 Tech Bubble. These valuations are pushed to higher levels, in part, due to a lower discount rate on future earnings. Valuations and interest rates seem to be inversely correlated. The ultimate reality is that we don’t know what the future holds. We do know, that at lower current yields, the portfolio protection purchased by $1 invested in bonds is less today than it was 10 years ago. This would seem to further bolster the argument that if bonds are still a viable protection against falling stock prices, then it will take a greater allocation to them in order to offset future bear markets.
One additional note, the above portfolio is utilized for illustrative purposes only, the Risk Parity model employed by us at Calibrate Wealth uses many other assets than the simple S&P 500 and 10 year Treasury bond. We believe that it is important to guard against a variety of economic outcomes of which an inflationary outcome is one that has not really been witnessed recently, but that will, like all things, arise again.
More information about Risk Parity
Risk Parity Portfolios with Risk Factors Thierry Roncalli and Guillaume Weisang