

Calibrate Tactical Risk Parity
The Pitfall of Traditional Portfolio Management: GIGO
Let’s face it Modern Portfolio Theory has had a good run, but like most things in life it could use a little updating from time to time. Since its creation in 1952, the “Modern” theory has attracted a large following of strict believers and practitioners. At its core is the belief, or attempt, to identify the optimal portfolio. The optimal portfolio would be the portfolio is the one with the best return to risk ratio. In other words, the best gain with the least amount of pain. While this attempt is a noble pursuit, and one worth the effort, we believe that the old, “modern” way relied upon too many assumptions which lead to a model prone to the “GIGO” effect, Garbage In Garbage Out.
Garbage In are assumptions based on unreliable inputs, such as the expected average annual return for assets. . The long-term average return is unstable and masks the true variability of each asset class’s returns and leads to error, or “garbage-out.” For example, while it is true that equities have outperformed bonds over extremely long periods, there are 30-years periods where bonds have outperformed stocks. A misallocation of funds for a 30-year period can be very costly for a client.
The Calibrate Difference
The Tactical Risk Parity Portfolio combines the best of Risk Parity with the adaptability of a momentum-based asset selection model. The portfolio selects the top performing assets on a relative performance basis and then adjusts the allocation to each based upon the risk contribution each one contributes to the overall portfolio. The goal of the portfolio is to follow longer economic and market trends without overexposing the investor to any one particular asset. We believe that this creates a dynamic risk mitigation strategy, which historically has led to shallower drawdowns and improved risk return outcomes.
Traditional Portfolios
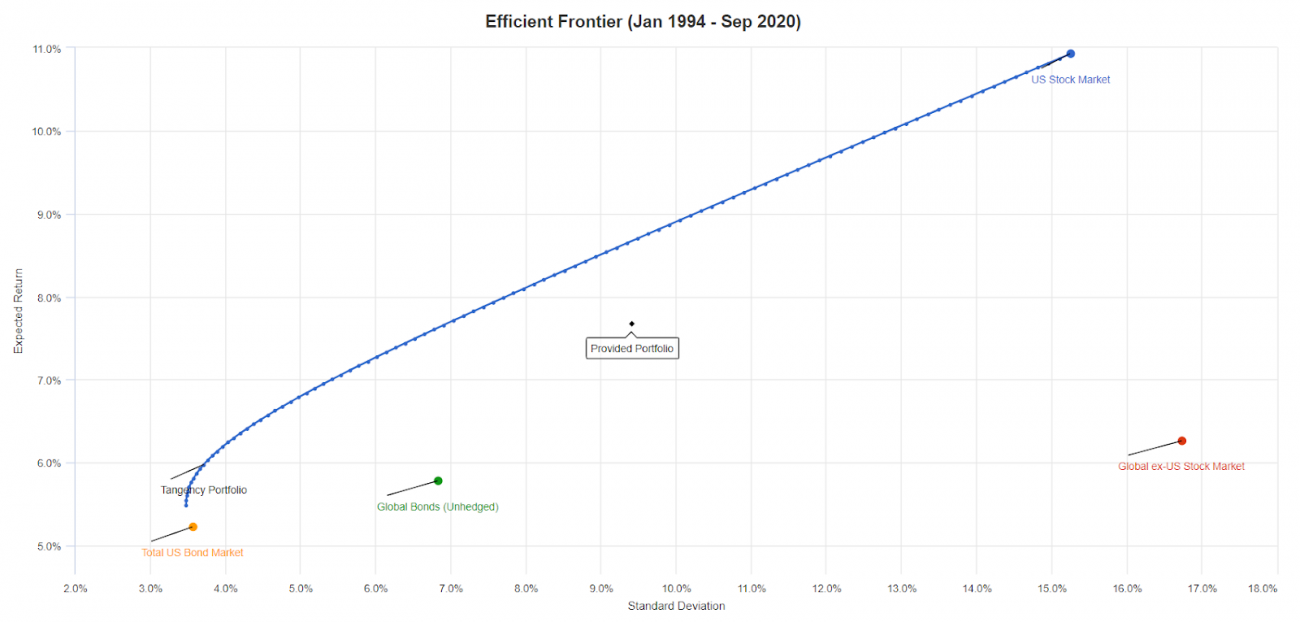
Below you will find a graph of an efficient frontier, in blue, which is a key concept in the MPT model developed by Markowitz. The tangency portfolio, seen at the lower left of the blue line, is the most efficient portfolio with the highest Sharpe ratio, which is essentially the best portfolio with respect to the return/risk tradeoff or most gain per unit of pain. This portfolio has the following key statistics:
- Expected annual return: 5.98% (A)
- Expected volatility: 3.71% (B)
- Sharpe ratio: 0.97 (A - risk-free rate)/B
The problem is that many financial plans, or investment mandates, require a higher rate of return and thus depart the efficient frontier. A typical growth portfolio, developed using a heuristic or “rule of thumb” approach, is labeled below as the “Provided Portfolio” in the middle of the graph. As you can see this portfolio is suboptimal, or below the blue efficient frontier, with respect to risk and return. The portfolio has a higher rate of return than the tangency portfolio but has a significantly lower Sharpe ratio due to disproportionately higher risk. Here are the stats:
- Expected annual return: 7.68% (A)
- Expected volatility: 9.41% (B)
- Sharpe ratio: 0.56 (A - risk-free rate)/B
In this case you are taking on a disproportionate amount of pain to get a little more gain.
The Tactical Risk Parity Portfolio
Continuing on, let's look at the performance of a portfolio that uses risk-parity and momentum concepts in concert. The portfolio in blue below labeled “Adaptive Allocation Model” is constructed using the top five performing assets, assets with relative momentum, out of a total of nine assets. These nine assets are as follows:
- Large-cap domestic equities
- Small-cap domestic equities
- Developed international equities
- Emerging market equities
- Long-term treasury bonds
- Intermediate-term treasury bonds
- Long-term investment grade bonds
- Real Estate
- Gold
The portfolio is then brought to “risk-parity” where each asset's risk contribution is equal. We decided to compare this portfolio to a Vanguard Balanced Index fund which is essentially 60% stocks and 40% in bonds. This is a common allocation utilized for investors and is traditionally thought of as balanced.
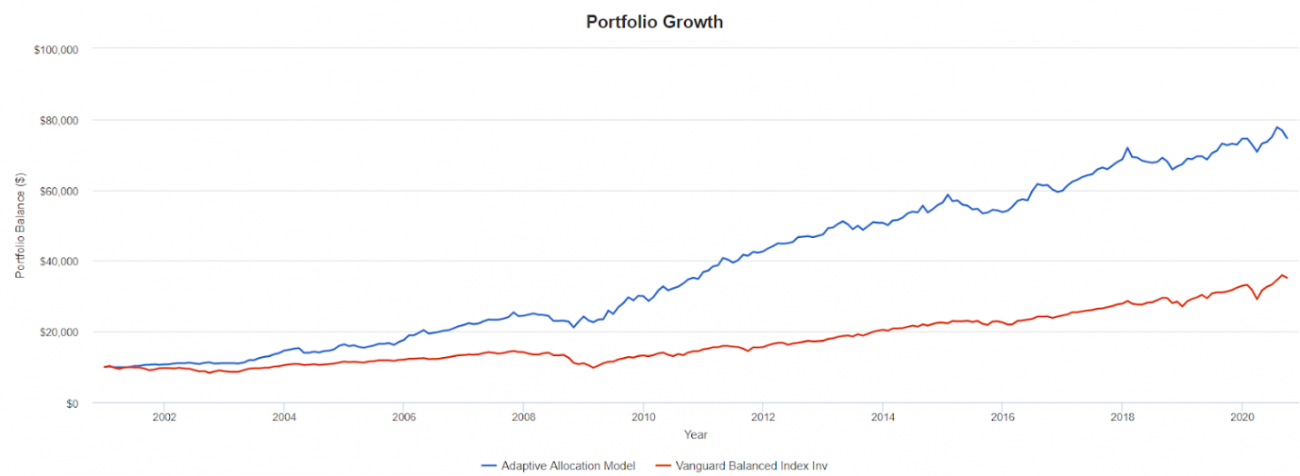
Here are the performance statistics:
Vanguard Balanced Index Fund
- Historical annual return: 6.57% (A)
- Historical volatility: 9.18% (B)
- Sharpe ratio: 0.59 (A - risk-free rate)/B
- Max drawdown: -32.57%
Adaptive Allocation Model
- Historical annual return: 10.72% (A)
- Historical volatility: 8.88% (B)
- Sharpe ratio: 1.04 (A - risk-free rate)/B
- Max drawdown: -16.74%
As you can see from the performance statistics, the hypothetical portfolio, constructed using risk parity and momentum, outperformed the classic balanced portfolio. In this example, the tactical risk parity portfolio has a Sharpe ratio commensurate with the optimal tangency portfolio described earlier but with a rate of return superior to the growth portfolio. More gain with less pain.
It is important to note that these portfolios were built and analyzed to illustrate the effect of combining both momentum and risk parity and comparing those results to a traditional portfolio. The actual portfolios implemented for clients at Calibrate Wealth vary. As always, past results do not imply continued future results. It is impossible to know whether risk-parity and/or momentum models will outperform in the future.
More Information